Exclusive: Living wage to create funding gap of hundreds of millions
Catherine Gaunt
Monday, August 24, 2015
The introduction of the 'national living wage' (NLW) next April will push the nursery sector into a deficit running into hundreds of millions of pounds without serious commitment from the Government to reforming the system of childcare funding.

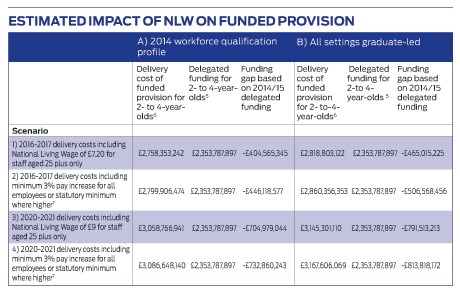
A funding gap of £404.57m in 2016/17 is forecast for implementing the NLW for staff aged 25 and over. This would increase to £446.12m should all employees receive a 3 per cent pay rise.
These losses are set to top more than £700m from 2020, or £800m-plus if all settings are graduate-led.
The sector, which is already beset by an underfunding crisis for the free places for two-, three- and four-year-olds, will be hit by the NLW, increases to the minimum wage, the new apprentice levy, and planned rises in employer pensions contributions.
The warning comes from the Pre-School Learning Alliance, which commissioned an analysis by research agency Ceeda on the future impact of policy changes such as the NLW on private, voluntary and independent (PVI) nurseries and pre-schools.
The figures show the extent to which early years providers will be affected by changes to wage legislation, as well as the Government's drive towards a graduate-led workforce.
Ceeda extrapolated figures from its 2014 Counting the Cost survey to calculate the impact of Government policies.
The study tracked costs for the delivery of 186,712 hours of early years education and childcare for 5,635 funded and non-funded children in 100 early years settings over two weeks in summer 2014. This included 3,488 funded three- and four-year-olds and 383 funded two-year-olds.
The figures also take into account rises to the minimum wage and apprentice rates, and automatic pensions enrolment.
Employers currently pay 1 per cent of earnings in pension contributions, but this is due to rise to 3 per cent by 2018.
Backed up by this evidence, the alliance is calling for a new approach to the way childcare is funded to ensure the sector's sustainability in the long-term.
The alliance said it is crucial that the Government's funding review must do more than just ensure that the extra 15 hours of childcare is funded at the right rate (ie, the 30-hour offer for three- and four-year-olds starting from September 2016). It must also ensure that current funding shortfalls facing providers delivering the existing 15-hour offer are addressed, before going ahead with any changes.
Alliance chief executive Neil Leitch said it was 'critical' that the funding review didn't just produce 'arbitrary' increases to funding rates, saying that the figures clearly showed why the funding review must lead to more than just 'a one-off uplift'. 'It's vital that Government takes into account the cost factors likely to impact early years providers in the future, both the more obvious ones - like the 'national living wage' - and those that are less apparent, such as planned rises in employer pensions contributions or the potential impact of the new apprentice levy,' he said.
'Add to this the cost implications of a graduate-led workforce - which the Government continues to push for - and it's clear that an entirely new approach to early years funding is necessary if the sector is to be sustainable in the long term. It's critical, then, that the aim of the review isn't to simply implement an arbitrary increase in funding rates in order to (temporarily) pacify the sector, but rather to put in place a viable mechanism that ensures that funding rates will continue to cover the cost of delivering places in the years to come, in the face of changing business costs.'
Dr Jo Verrill, managing director of Ceeda, said that evaluating the cost of delivering quality provision is a complex process, which needs to reflect the reality of delivery.
'The Government's funding review will be critical in ensuring long-term sustainability and investment in the PVI sector,' she said. 'Strategies to improve the pay and qualifications of the early years workforce are welcome, but must be matched with appropriate funding if they are not to prove counterproductive. Government research has shown that 46 per cent of full day care providers and 64 per cent of sessional settings break-even or make a loss (Childcare and Early Years Provider Survey 2013).
'2020 scenarios are a major concern; without a significant shift in funding levels it is likely that we will see a decline in the volume, quality and affordability of supply in the market.'

See notes on the table's data below.
COST PREDICTIONS FOR THE EARLY YEARS SECTOR
SCENARIO 1: Cost impact of NLW introduction in 2016 only (taking
wage differentials into account - by factoring in a minimum 3% pay
increase for all employees or statutory minimum where higher)
Three- and four-year-olds
- Hourly cost of delivery = £4.68
- Hourly shortfall = £0.73 (18%)
- Annual shortfall (per child taking up 30 hours) = £832.20
- Total annual (PVI non-domestic) sector shortfall = £315,101,816
Two-year-olds
- Hourly cost of delivery = £6.21
- Hourly shortfall = £1.06 (21%)
- Annual shortfall per child = £592.80
- Total annual sector shortfall = £131,016,760
Overall sector shortfall (for two-, three- and four-year-old provision) = £446,118,577
SCENARIO 2: Cost impact of NLW introduction in 2016 (taking wage differentials into account) AND a graduate-led workforce
Three- and four-year-olds
- Hourly cost of delivery = £4.75
- Hourly shortfall = £0.80 (20%)
- Annual shortfall (per child taking up 30 hours) = £912
- Total annual (PVI non-domestic) sector shortfall = £345,317,059
Two-year-olds
- Hourly cost of delivery = £6.43
- Hourly shortfall = £1.28 (25%)
- Annual shortfall = £729.60
- Total annual sector shortfall = £161,251,397
Overall sector shortfall (for two-, three- and four-year-old provision) = £506,568,456
SCENARIO 3: Cost impact of NLW increase to £9 in 2020 (taking wage differentials into account) only
Three- and four-year-olds
- Hourly cost of delivery = £5.14
- Hourly shortfall = £1.19 (30%)
- Annual shortfall (per child taking up 30 hours) = £1356.60
- Total annual sector shortfall = £513,659,125
Two-year-olds
- Hourly cost of delivery = £6.89
- Hourly shortfall = £1.74 (34%)
- Annual shortfall = £991.80
- Total annual sector shortfall = £219,201,118
Overall sector shortfall (for two-, three- and four-year old provision) = £732,860,243
SCENARIO 4: Cost impact of NLW increase to £9.00 in 2020 (taking wage differentials into account) AND a graduate-led workforce Three- and four-year-olds
- Hourly cost of delivery = £5.24
- Hourly shortfall = £1.29 (33%)
- Annual shortfall = £1,470.60
- Total annual sector shortfall = £556,823,758
Two-year-olds
- Hourly cost of delivery = £7.19
- Hourly shortfall = £2.04 (40%)
- Annual shortfall = £1,162.80
- Total annual sector shortfall = £256,994,414
Overall sector shortfall (for two-, three- and four-year old provision) = £813,818,172.
Read Neil Leitch on the funding gap here.
NOTES ON THE TABLE
1. All data relates to non-domestic private, voluntary and independent (PVI) childcare providers in England only. Figures EXCLUDE maintained provision and childminders.
2. Figures assume every eligible child takes up their full entitlement
3. All figures are EXCLUSIVE of any profit margin.
4. All figures are EXCLUSIVE of unpaid overtime.
5. Funding data: Department for Education (2015) Early Years Benchmarking Tool: Delegated budgets allocated to PVI providers per pupil per hour 2014/2015. England averages. Published delegated hourly funding rates include supplements for quality and flexibility but exclude SEND and EYPP funding. No allowance is made for increases in hourly funding rates in the current financial year or future increases resulting from the funding review.
6. Source of cost data: Ceeda (2015) Counting the Cost Additional Data Tables. Figures are based on the following samples:
England funded 2 year olds 2014 qualification profile: 383 children in 73 non-domestic childcare settings
England funded 3 and 4 year olds 2014 qualification profile: 3,488 children in 100 non-domestic childcare settings
England funded 2 year olds graduate led workforce profile: 168 children in 34 non-domestic childcare settings
England funded 3 and 4 year olds graduate led workforce profile: 1,666 children in 45 non-domestic childcare settings
7. 'National Living Wage' increases are likely to lead to wage inflation across the workforce in order to retain younger staff and maintain pay differentials. Scenarios two and four model a 3% increase on 2014 gross hourly pay rates reported in the original 'Counting the Cost' study. Minimum wage or national living wage rates apply where higher. The 3% figure is applied to 2014 base rates in both scenarios and is not compounded. Between March to May 2014 and March to May 2015 in nominal terms (that is, not adjusted for consumer price inflation) regular pay (excluding bonuses) for employees in the service sector in Great Britain increased by 3.0%.ONS (2015) UK Labour Market, July 2015. Table 17 Average Weekly Earnings - regular pay. This figure has been used to factor modest cross-sector wage inflation.
8. Scenarios 1 and 2 in each table do not make allowance for Consumer Price Index inflation (CPI). Scenarios 3 and 4 assume 2% CPI
9. Population base for 3 to 4 years 15 hour entitlement as reported in DfE (2015) Provision for children under 5 years of age in England: January 2015 Table 7A. Population base for 30 hour entitlement Government estimate of 3 and 4 year olds in working households (600,000 children of whom an estimated 39% will take up provision in non-domestic PVI settings).The estimated number of eligible children for funded 2 year old provision is derived from data supplied to the Department for Education by the Department for Work and Pensions in November 2014 on the number of children believed to meet the benefit and tax credit eligibility criteria. It represents the best data available on the number of eligible children.
10. Table shows delivery costs where workforce qualification profile is as reported in the original Counting the Cost study (Ceeda 2014) and if all settings were to employ at least one qualified EYP or EYT.


